조인성 교수께서 제작하신 tzplot이 2.0으로 업데이트되었는데, 엄청난 기능의 확장으로 이루어져 있습니다. 저는 이것을 "TikZ 사용성 패키지"라고 부르고 있습니다.
그림을 한번 그려보았습니다. 매뉴얼을 찾아가면서 그린 건데 이런 종류의 그래프를 그리는 데 이보다 더 편리한 방법을 찾기 쉽지 않을 듯합니다. 물론 tzplot이 이런 종류의 그림만 그릴 수 있는 것은 아니고 대부분의 tikz 작업을 더 쉽고 직관적-논리적으로 할 수 있게 합니다.
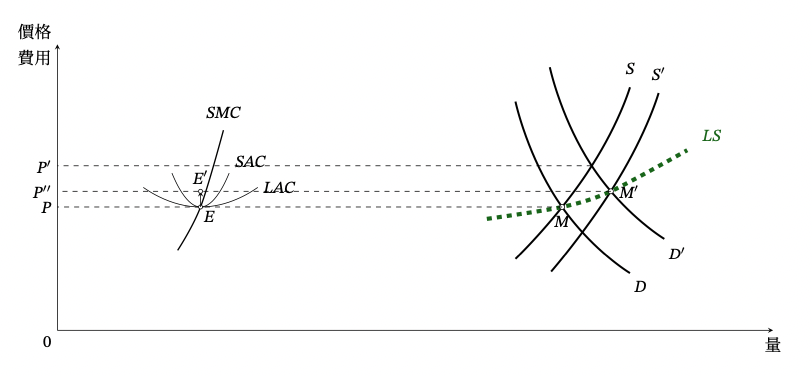
이 그림은... 조순 정운찬 <경제학 원론> (1990) 제4전정판의 p.197에 나오는 것입니다. 이걸 그려보면서 느낀 건데, 교점을 찾아주고 좌표값을 재사용할 수 있는 것은 정말 편하네요.
\begin{tikzpicture}[scale=.6]
%\tzhelplines(25,10)
\tzshoworigin
\tzaxes(25,10){量}[b]{\parbox{2em}{價格\\費用}}[l]
\tzplotcurve[very thick]<14,0>"D0"(2,8)(3.5,4.5)(6,2){\em D}[-60,inner sep=0pt];
\tzplotcurve[very thick]<1.2+14,1.2>"D1"(2,8)(3.5,4.5)(6,2){\em D$^\prime$}[-60,inner sep=0pt];
\tzplotcurve[very thick]<14,0>"S0"(2,2.5)(4.5,5.5)(6,8.5){\em S};
\tzplotcurve[very thick]<1+14,-.2>"S1"(2cm+7pt,2.5cm-7pt)(4.6,5.5)(6,8.5){\em S$^\prime$};
\tzXpoint{D0}{S0}(E0) \tzXpoint{D1}{S1}(E1) \tzXpoint{D1}{S0}(E2)
\tzplotcurve[line width=2.5pt,green4,dashed]{.5}(1+14,3.9)(E0)(E1)(8+14,6.3){\em LS}[15];
\tzdot[fill=white](E0){\em M}[b](3pt) \tzdot[fill=white](E1){\em M$^\prime$}[r](3pt)
\tzprojy[dashed](E0){\em P} \tzprojy[dashed](E1){\em P$''$} \tzprojy[dashed](E2){\em P$'$}
\tzgetxyval(E0){\ignoreX}{\Ezero} \tzgetxyval(E1){\ignoreX}{\Eone}
%\tzgetxyval(E2){\ignoreX}{\Etwo}
\tzparabola(3,5)(5,\Ezero)(7,5){\em LAC}[r]
\tzparabola(4,5.5)(5,\Ezero)(6,5.5){\em SAC}[ar]
\tzplotcurve[thick]{.6}(4.2,2.8)(5,\Ezero)(5.8,7){\em SMC};
\tzdot[fill=white](5,\Ezero){\em E}[below right,inner sep=1pt]
\tzline[->](5,\Ezero)(5,\Eone)
\tzdot[fill=white](5,\Eone){\em E$^\prime$}[a]
\end{tikzpicture}
멋진 패키지를 제작해주신 조인성 교수께 감사드립니다.
KTUG 한국 텍 사용자 그룹